Case Studies: Advanced
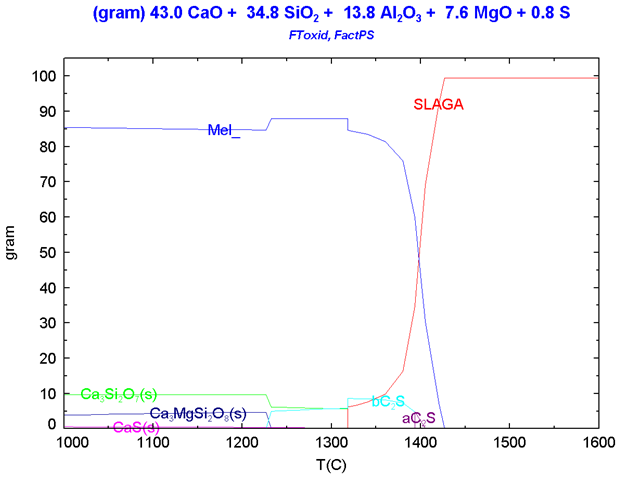
Analysis of Blast Furnace Slag
The figure below illustrates the calculation of the equilibrium composition and melting point of blast furnace slag, where SLAGA represents the molten phase. The slag begins to melt at 1318°C. Mel_ denotes a solid solution with a melilite-type crystal structure, while aC2S and bC2S are belite phases, which are essential components of cement clinker. At lower temperatures, sulfur is present as CaS(s). Although not displayed in this graph, the sulfur content within the molten slag is also precisely calculated and can be visualized upon request. (Databases: FToxid, FactPS)
Desulfurization of Molten Steel
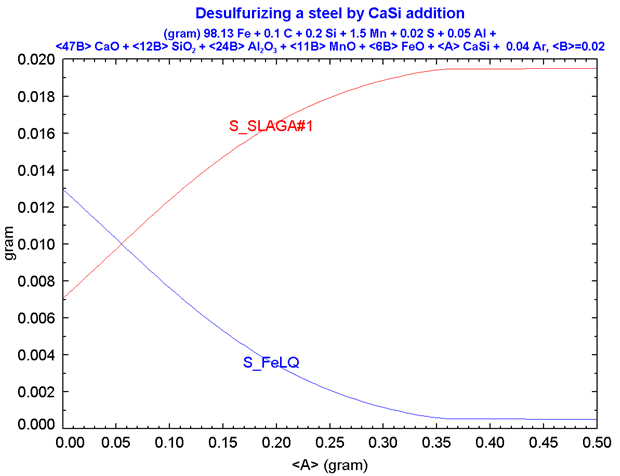
The figure below illustrates the analysis of the desulfurization process in steelmaking. In this process, slag is introduced to remove sulfur from the molten steel, and CaSi is added as a desulfurizer. "S_FeLQ" represents the sulfur content within the molten steel, which decreases as the amount of CaSi addition increases. However, the simulation reveals that adding more than 0.35 grams of CaSi yields no further reduction in sulfur. (Databases: FToxid, FactPS)
Coal Combustion Analysis
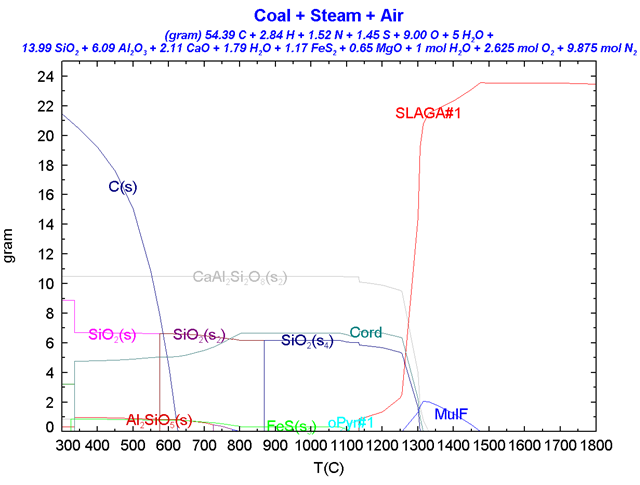
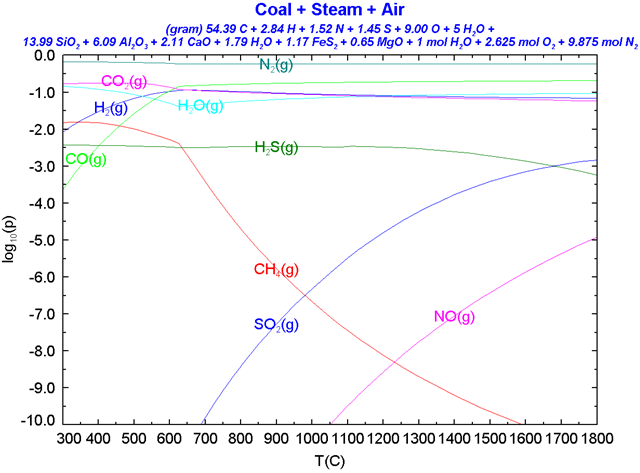
The two figures below illustrate the calculated reaction between a specific type of coal, steam, and air. The first figure shows the quantities of solid and liquid phases, where "SLAGA#1" represents the liquid phase, and "MulF," "oPyr#1," and "Cord#1" denote oxide solid solutions. The second figure displays the partial pressures of each combustion gas component. This type of simulation is highly effective for comparing variations in products based on coal origins or evaluating changes when altering the injected gas composition. It also enables the assessment of air pollutant emissions, such as SOx and NOx. (Thermodynamic Databases: FToxid, FactPS)
Combustion of Black Liquor
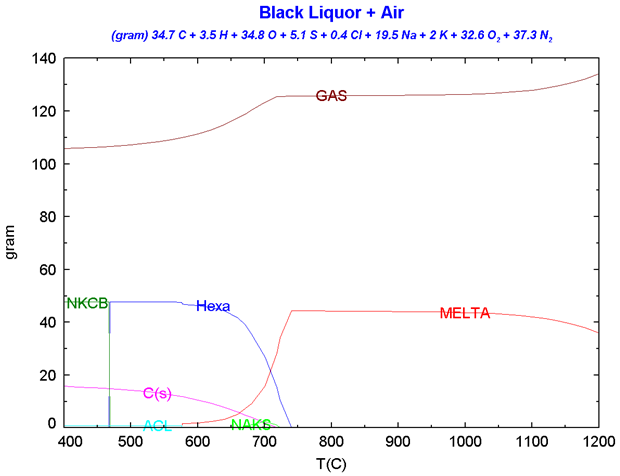
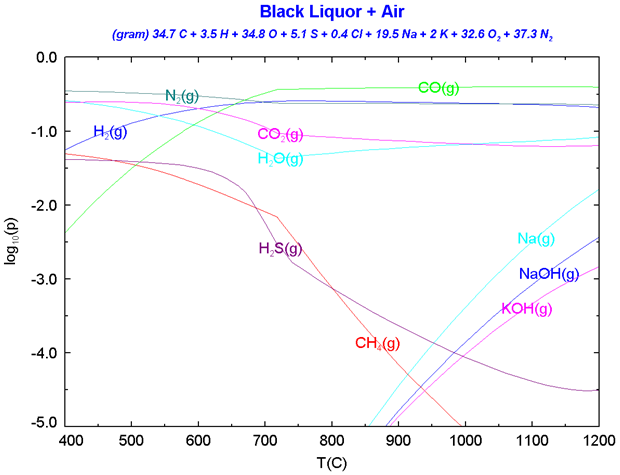
The two figures below illustrate the calculated reaction between black liquor and air. The first figure shows the amounts of each phase, where "MELTA" represents the liquid phase, and "NKCB," "ACL," "Hexa," and "NAKS" denote solid solutions. This simulation is highly effective for investigating the behavior of substances inside recovery boilers. The second figure displays the partial pressures of each combustion gas component. (Databases: FTpulp, FactPS)
Combustion of Gasoline (Octane)
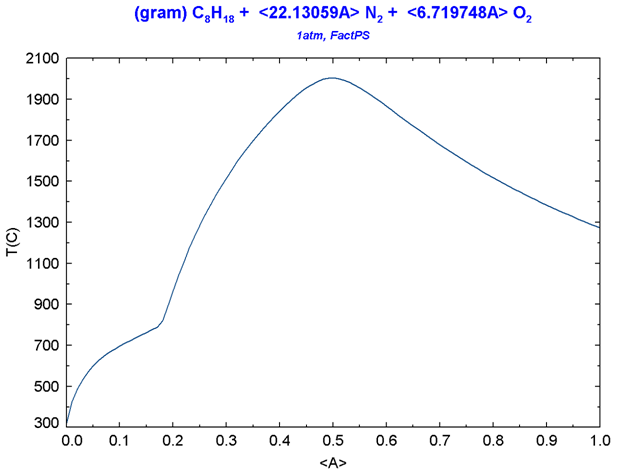
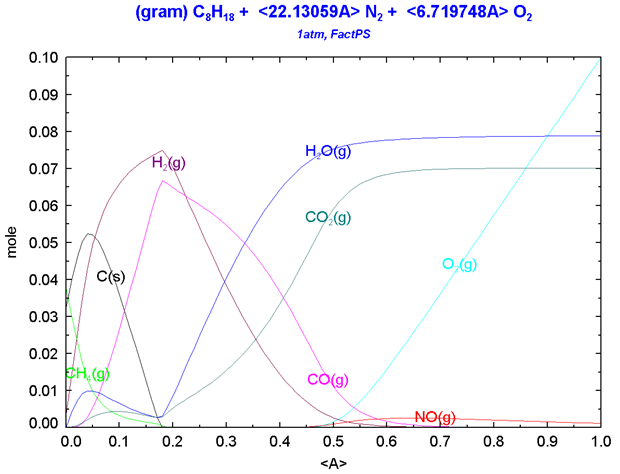
The two figures below illustrate the combustion calculations of gasoline, with octane serving as the representative component. The first figure shows the variation in theoretical (adiabatic) flame temperature as the amount of air mixed with octane changes. The second figure displays the corresponding equilibrium composition. The parameter "A" represents the air amount, where the right end of the graph (A = 1) corresponds to 0.79 mol of nitrogen and 0.21 mol of oxygen. The combustion temperature reaches its peak at A = 0.5, yielding an air-fuel ratio of 14.4. The behavior of NO formation is also clearly identifiable. (Database: FactPS)
Heavy Metals in Burned Ash
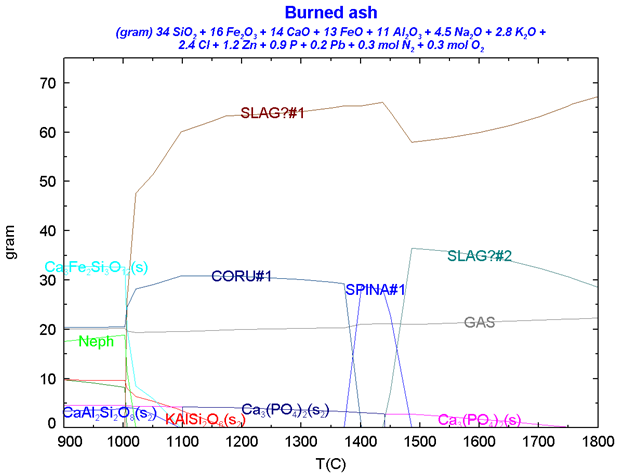
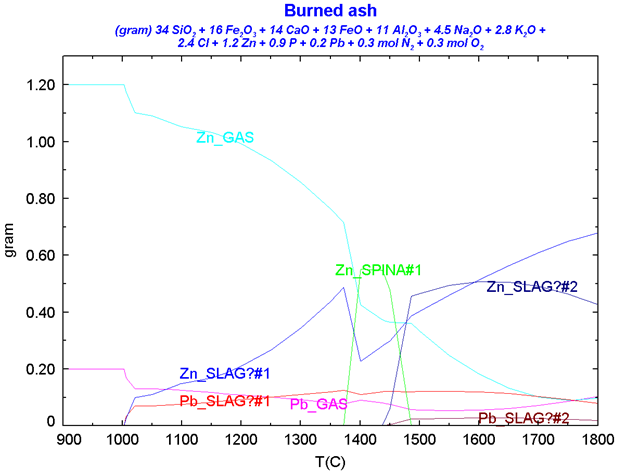
The two figures below illustrate the equilibrium composition of burned ash. The first figure shows the amounts of stable phases; when molten slag undergoes phase separation, it is expressed as "SLAG?#1" and "SLAG?#2," allowing users to view each respective amount. "CORU#1," "SPINA#1," and "Neph" represent solid solution phases with corundum, spinel, and nepheline crystal structures, respectively. The second figure demonstrates how heavy metals are distributed among the gas, liquid, and solid solution phases. (Databases: FToxid, FactPS)
Manufacturing of Ultra-Pure Silicon
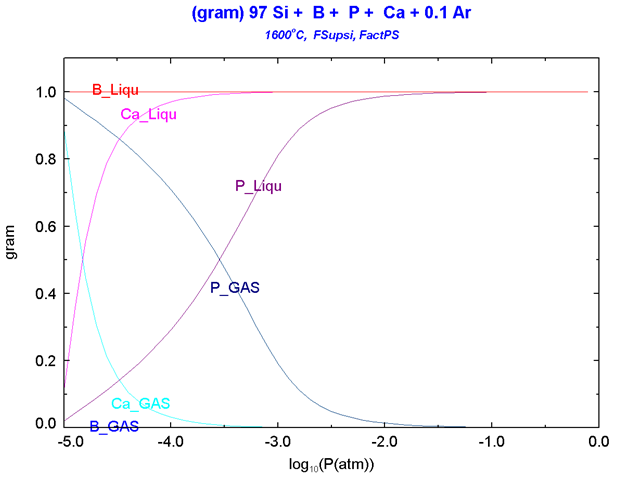
The behavior of phosphorus, calcium, and boron impurities within silicon was investigated. The figure below illustrates the concentration changes of these impurity elements in both the gas phase and the silicon melt when contaminated silicon is melted at 1600°C and the external pressure is reduced. The simulation indicates that phosphorus is expected to be effectively removed using this method, whereas boron remains unremoved. (Databases: FSupsi, FactPS)
Precious Metal Alloy Liquidus Projection
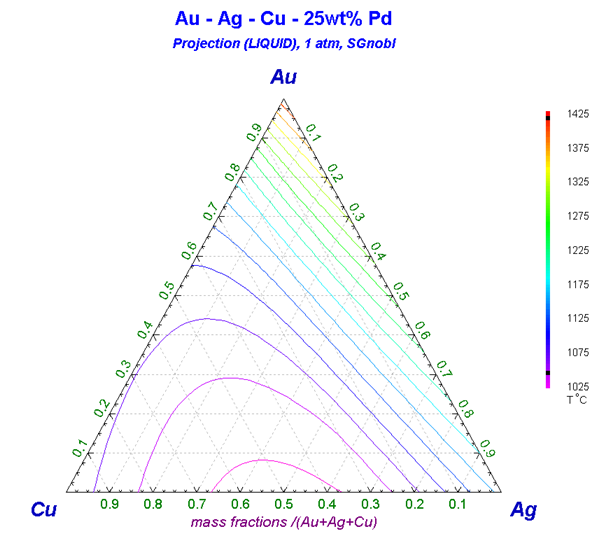
This diagram displays the liquidus projection of a noble metal alloy with a fixed palladium (Pd) content. It provides an immediate, clear overview of how liquidus temperatures change in response to compositional variations. (Database: SGnobl)
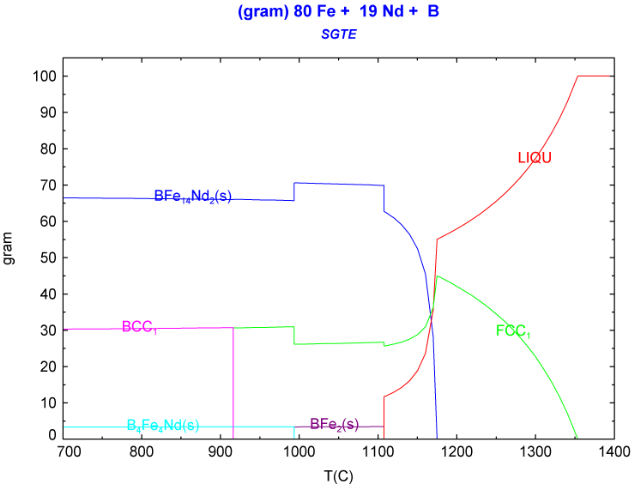
Equilibrium Composition of Neodymium Magnets (Fe-B-Nd System)
The figure below illustrates the temperature-dependent changes in the equilibrium composition of a neodymium magnet system. "LIQU" represents the liquid phase, while "BCC1" and "FCC1" denote solid solution phases. At temperatures above 1353.37°C, only the liquid phase exists. As the temperature decreases, the FCC solid solution emerges, followed by the appearance of BFe14Nd2(s) at 1174.84°C, creating a solid-liquid coexisting state. Below 1107.71°C, the liquid phase disappears completely, leaving only solid phases. Although not displayed in this graph, the elemental composition of each phase is also calculated and can be visualized. (Database: SGTE)