Case Studies: Basic
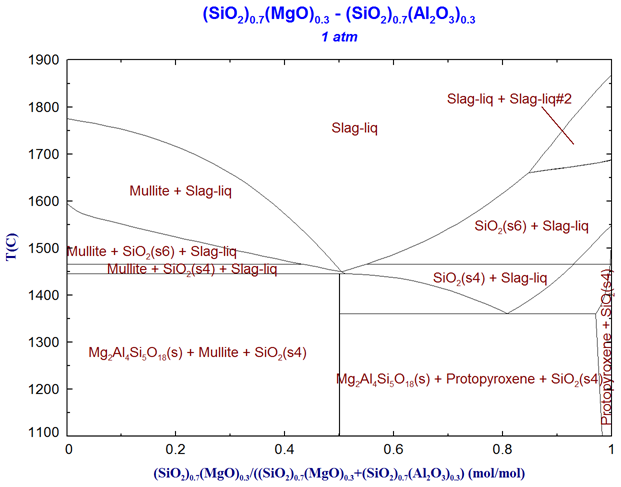
Pseudo-Binary Phase Diagram of the SiO2-MgO-Al2O3 System
Equilibrium calculation of high-temperature oxides is a primary strength of FactSage. In oxide liquid, strong attractive and repulsive forces between atoms lead to short-range ordering. The FactSage thermochemical database utilizes a modified quasi-chemical model (MQM) that incorporates these short-range ordering effects. (Database: FToxid)
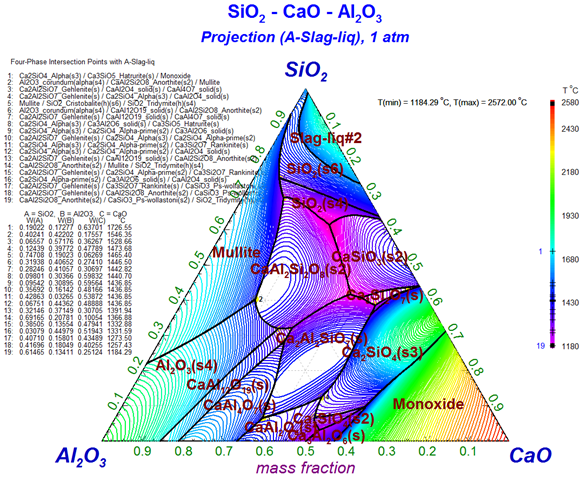
Liquidus Projection of the SiO2-CaO-Al2O3 System
Liquidus projection diagrams can be calculated with simple settings. (Database: FToxid)
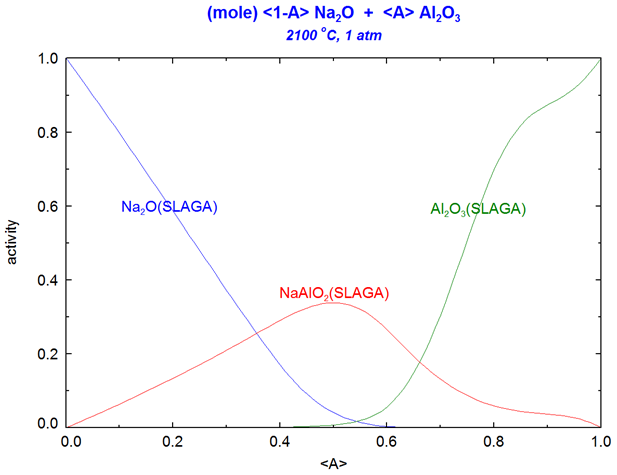
Activities of Components in Na2O-Al2O3 Molten Slag
This is an example showing the activities of components in molten slag. (Database: FToxid)
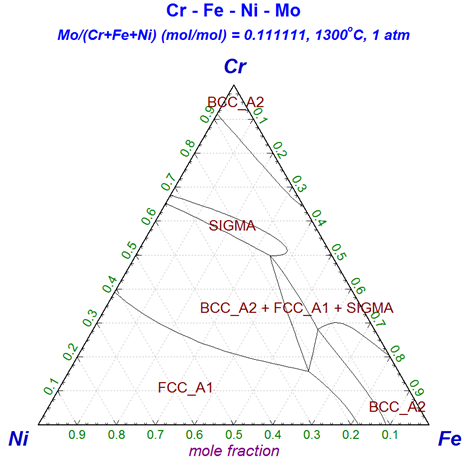
Multicomponent Alloy Phase Diagram of the Cr-Fe-Ni-Mo System
In addition to binary and ternary systems, phase diagrams for quaternary and higher-order systems can be calculated. To represent a quaternary system within a triangular diagram (Gibbs triangle), the concentration of one component is kept fixed. The figure illustrates a phase diagram with a fixed content of 10 mol% Mo. (Database: SGTE 2017)
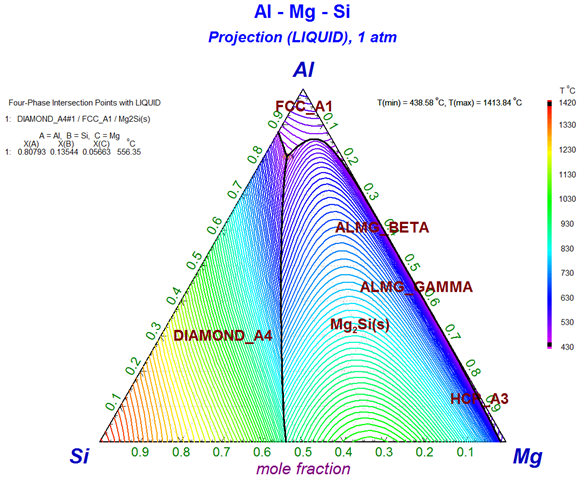
Liquidus Projection of the Al-Mg-Si System
Liquidus projection diagrams for alloys can also be calculated with simple settings. This allows for the easy identification of the composition with the lowest melting point (eutectic composition). (Database: SGTE 2017)
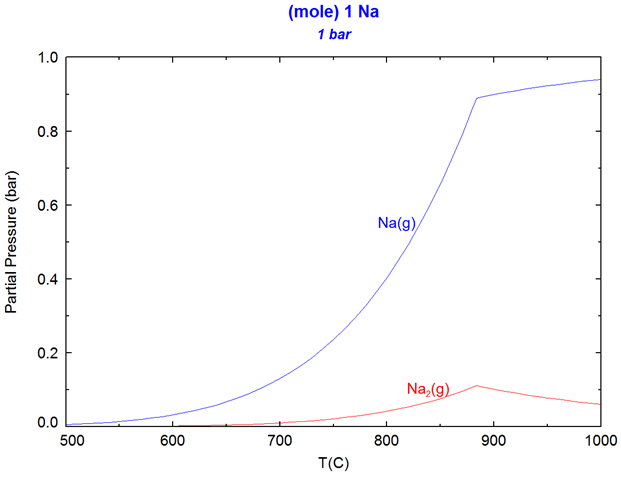
Partial Pressure of Na Vapor
The vapor pressure and partial pressures of mixed gas components can be calculated. Sodium vapor is a gas mixture consisting of Na and Na2. The figure below illustrates the temperature dependence of these partial pressures. Above the boiling point (calculated at 883.52 °C), the partial pressure of Na2 decreases as the temperature rises. (Database: FactPS)
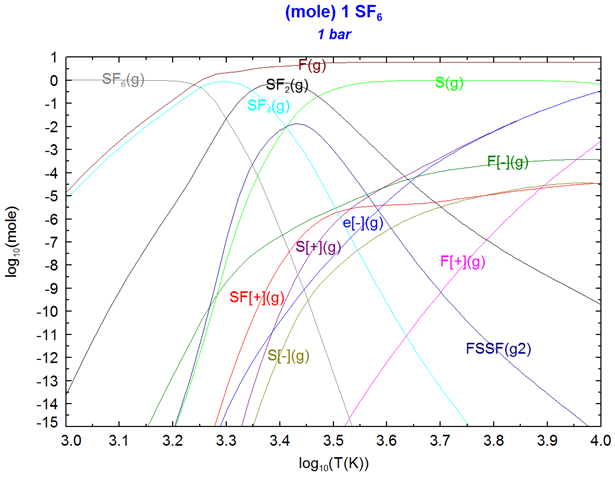
Plasma Composition
Thermal plasma analysis is also supported. Calculating the equilibrium composition of sulfur hexafluoride (SF6) at high temperatures reveals the formation of ions (F[-], S[+]) and electrons (e[-]). Although the figure below plots only the major chemical species, a total of 36 species are considered in this calculation. (Database: FactPS)
Solidification analysis of Al-Li alloys utilizing the Scheil-Gulliver model
Example of solidification analysis via Scheil-Gulliver model calculation (Database: FTlite).
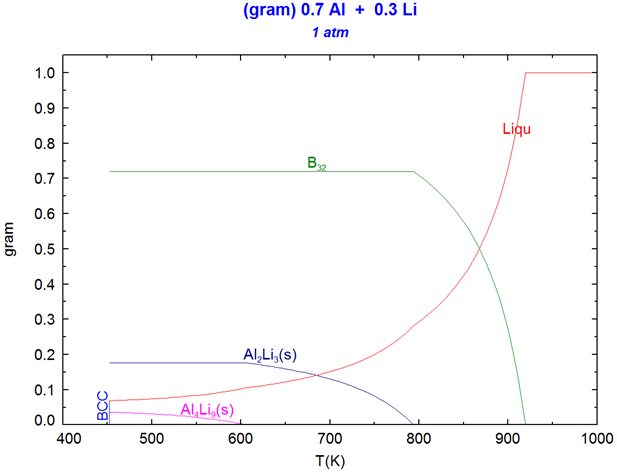
Relationship between liquid phase composition and precipitates in solidification analysis
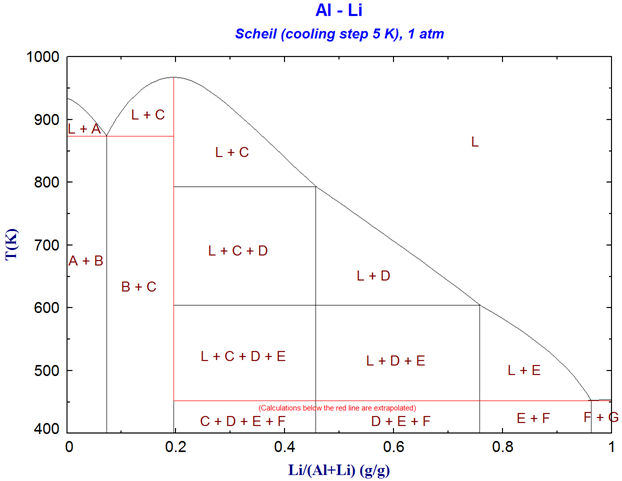
The previous example demonstrated the calculated precipitates when cooling a molten alloy of a specific composition (Li mass fraction of 0.3). The diagram below illustrates the variations in precipitates as the composition changes (Scheil-Gulliver Constituent Diagram). Abbreviations in the figure denote: L = Liquid, C = B32, D = Al2Li3(s), and E + F = Al4Li9(s) + BCC. (Database: FTlite)
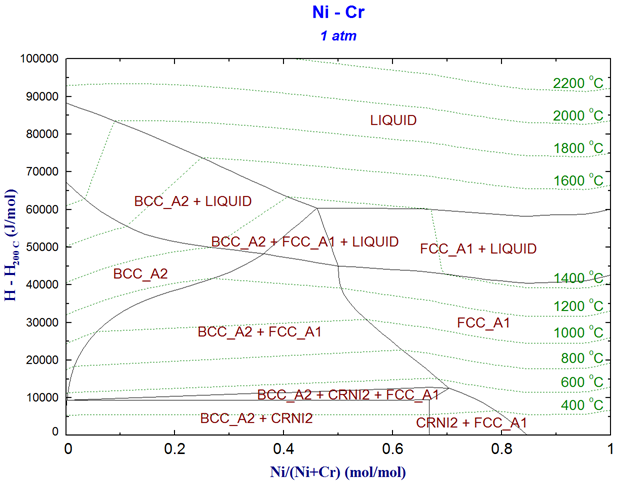
Enthalpy change phase diagram for the Ni-Cr system
The vertical axis of the phase diagram below represents the enthalpy change (Delta H) rather than temperature. This diagram allows users to evaluate the resulting composition and temperature of the system when heat is applied. (Database: SGTE 2017)
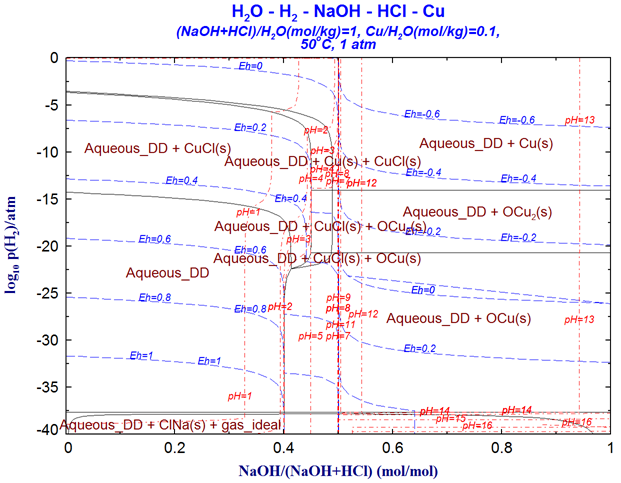
Aqueous Phase Diagram for the Cu-H2O-HCl-NaOH System
The following is a phase diagram of a copper (Cu) aqueous system. To account for variations in pH, both HCl and NaOH are incorporated. The diagram displays iso-pH and iso-potential lines, providing a clear overview of the potential-pH relationship. (Database: FThelg, FactPS)
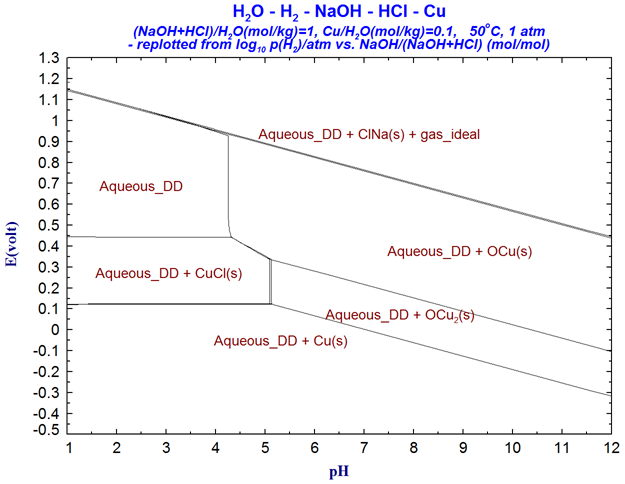
A new approach to Cu potential-pH diagrams
The Cu aqueous phase diagram shown above can be seamlessly transformed into a diagram with potential on the vertical axis and pH on the horizontal axis--matching the standard potential-pH (Pourbaix) diagram format. This represents an innovative, new approach to potential-pH visualization. (Database: FThelg, FactPS)
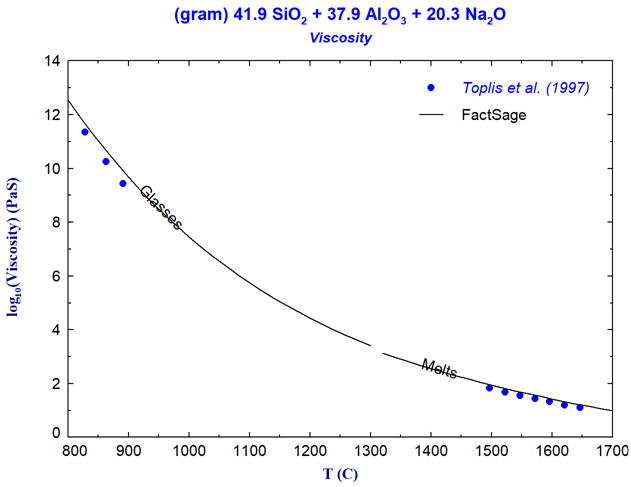
Viscosity of molten slag in the SiO2-Al2O3-Na2O System
Easily calculate the viscosity of both molten slag and molten glass with high accuracy.
Binary Phase Diagrams
The Gibbs Energy Database for FactSage (GeDb) offers free access to calculated phase diagrams and thermodynamic databases for various binary systems, compatible with FactSage 7.0 and later versions.
Please follow the link below to explore the binary systems of interest to you.
https://www.rccm.co.jp/factsage/gedb-open/periodic.html